Attach here with the link of a pop quiz.
http://www.proprofs.com/quiz-school/story.php?title=NjEwOTA0
Wednesday, 18 December 2013

7. FREQUENTLY ASKED QUESTIONS (FAQ)
1. What is the difference between pretesting and trialling?
They both involve trying out test materials on a representative sample of the
test group to gather various types of information about their performance and
measurement characteristics.
· Pretesting
is a general term for this kind of activity, but it is also use more
specifically to refer to occasions when test materials are administered to
large groups of test-takers in order to carry out a range of statistical
studies on the scores produced.
· Trialling
is often used to refer to a form of pretesting involving much smaller groups of
test-takers who can provide useful feedback on different performance aspects of
the test materials.
2.
How can pretesting help teachers and learners?
It
helps learners to know which areas they need most practice in, and gives them
experience and confidence in taking tests. For teachers, it helps highlight
areas where their learners need more help.
3. Are items/questions pretested? If yes, how are students selected?
Most
of the examination boards did pretesting; as most of them think that it has
pretested items on a few students “as security of material is essential” and
the other said test-types and difficult items were pretested informally by
settlers/examiners in their own school using secure candidates.
4.If items/questions are pretested, how are they being analyzed?
Majority
wise, for objective tests, there are two methods being applied to calculate for
each objective test item.
(i)
The facilty value (F.V.)
(ii)
The discrimination index (D.I.)
However,
for subjectively marked tests like summaries, essays and oral interview, there
will be no definite statistic can be used. However, there will be marking
guideline and criteria to ensure the trial marking session should follow the
general patterns.
5.What happens if trial items/ questions are unsatisfactory?
If
items proved to be unsatisfactory, they were either rewritten or discarded.
However, there are some testing centres like UCLES which have said that any
revised items will have to go through another pretesting cycle. Every time an
item is rewritten it should be tried out again, as there is no guarantee that
an edited item will be any more successful than the previous item. In reality,
retrialling of items seems to be impossible, for that case, item analysis
should be carried out after the live test has been administered, and faulty
items should be omitted from the final scores.
6.What steps, if any, are to be taken to monitor the quality of individual
item/ test writers
·The designers or the objectively marked papers were involved
in editing sessions and were monitored by the overseeing chair and the subject
officer.
·A training course for item writers is provided.
·Draft tests were monitored and feedback was given to writers
before the exam.
· Markers provide feedback after the administration of an exam,
and the item writers’ work was then monitored.
·Those item writers with “moderation revealed quality” while
unsatisfactory writers were “discontinued”.
4. TABULATION & ANALYSIS OF DATA
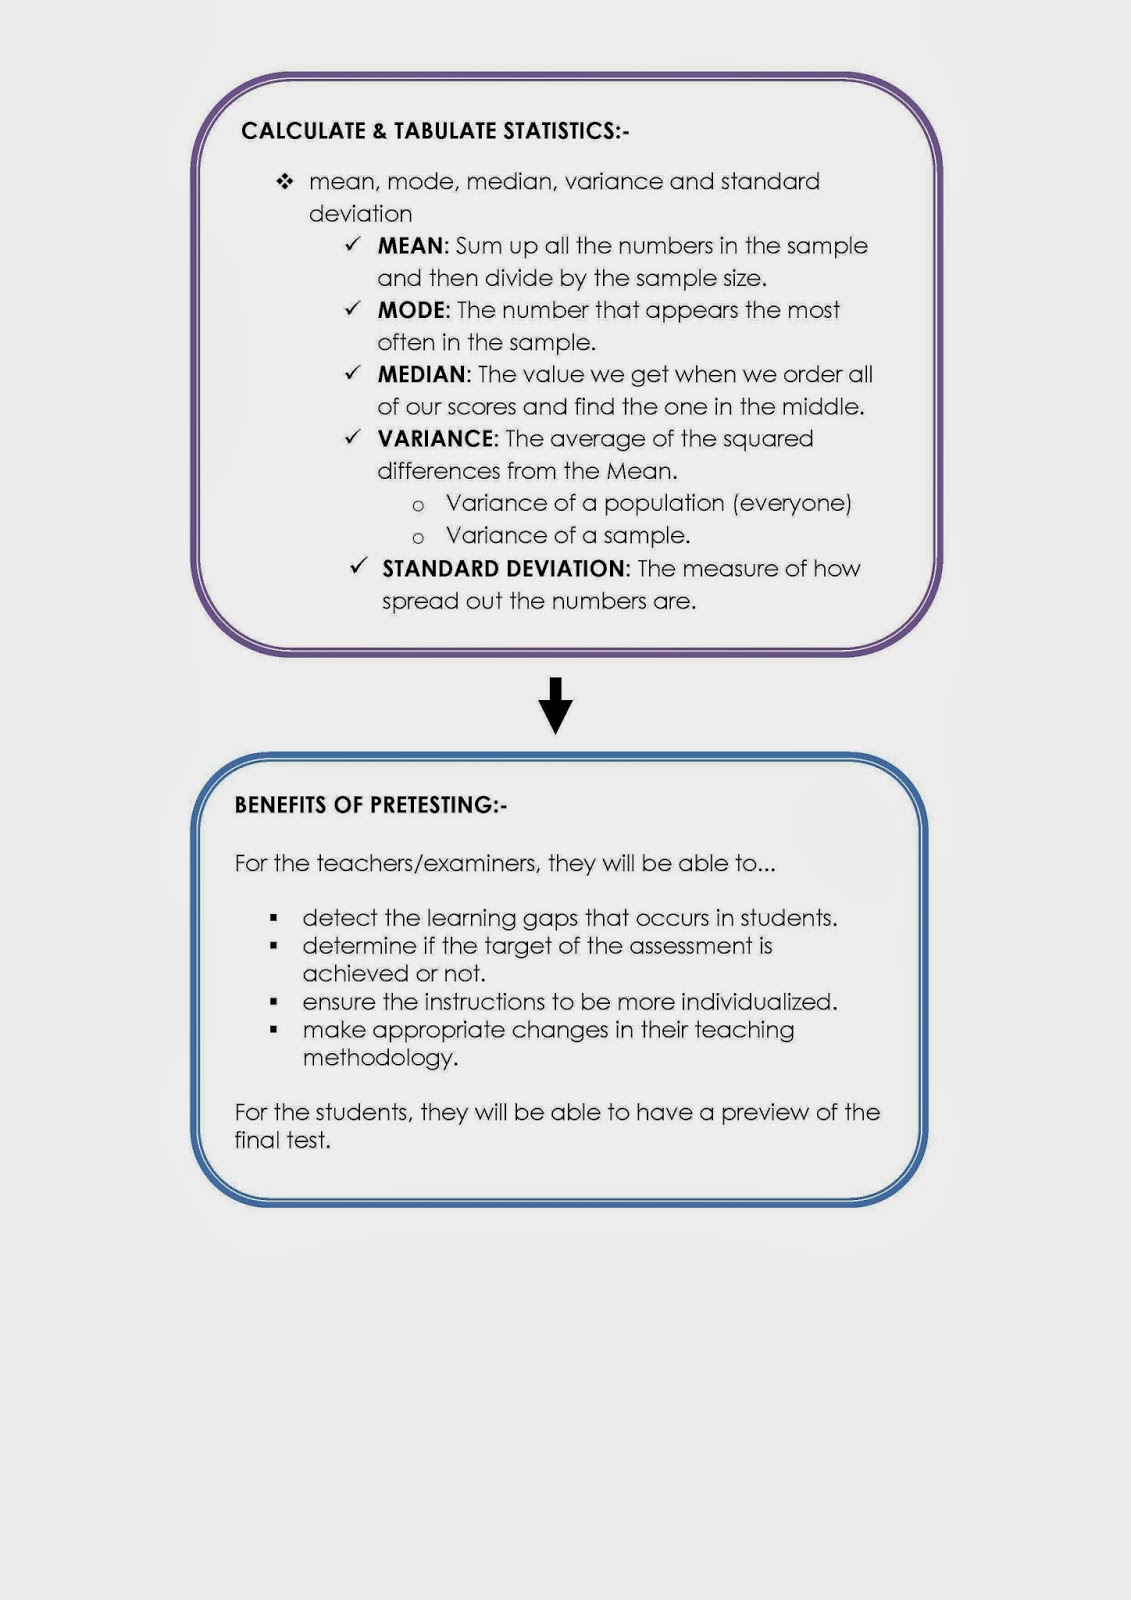
In Statistics,
the most important calculations are the mean, mode, median, variance and
standard deviation. Statistics begins with a set of numbers which are called
the Sample. The set of all possible
numbers is called the Populations. Let’s
say that we have 20 students in a class with their English Test score scale
from 50-100. Then the sample size is 20 and the population is the set of all
people who have take or will take the test.
The Table shown
below is an example of the tabulation of students’ score.
Student
|
Score
|
Student 1
|
55
|
Student 2
|
77
|
Student 3
|
90
|
Student 4
|
66
|
Student 5
|
71
|
Student 6
|
67
|
Student 7
|
66
|
Student 8
|
81
|
Student 9
|
66
|
Student 10
|
88
|
Student 11
|
73
|
Student 12
|
66
|
Student 13
|
85
|
Student 14
|
82
|
Student 15
|
66
|
Student 16
|
76
|
Student 17
|
64
|
Student 18
|
66
|
Student 19
|
90
|
Student 20
|
87
|
To calculate the
mean, you sum up all the numbers in the sample and then divide by the sample
size. The sum is 1475. The mean is 1475/20 = 73.75.
CALCULATING THE
MODE
The mode is the
number that appears the most often in the sample.
To calculate the
mode, we count the number of times each rating is made. In the sample above,
the number that appears the most often is “66” that appeared for 6 times in the
table. Hence, the mode is 66.
But what would
happen if we have the following sequence : 66,66,70,77,77
In this case, a
conclusion that can be draw is that there is no unique mode. A mode is unique
if and only if ONE number is more frequent than all others.
What if the
sample size is too big such as > 50 ? It would cost a lot of time and may
contain inevitable human mistake in arranging the data. Hence, we can make use
of Microsoft Excel in calculating the median for us. Firstly, the score is
entered into the Microsoft Excel and let’s use the tabulation above as example.
As the result, the data entered would range from row A2 to A21. After that, at
the column below the last data insert this formula in order to get the MODE ;
=Mode(A2:A21) and press enter.

CALCULATING THE
MEDIAN
The median is the
value we get when we order all of our scores and then find the one in the
middle. But what happens if the sample size is even? In this case, we can add
the two middle numbers and then divide by 2. For the tabulation above, the
sample size is 20 which is even and hence the two middle numbers need to be
divided by 2 and the result is 72.
***BEAR IN MIND
THAT ALL THE SCORE MUST ARRANGE IN A ASCENDING ORDER BEFORE CALCULATING THE
MEDIAN IN ORDER TO GET THE CORRECT RESULT.***
Similarly to the
mode, we can use Microsoft Excel to calculate the median of a set of data.
Firstly, the score is entered into the Microsoft Excel and let’s use the
tabulation above as example. As the result, the data entered would range from
row A2 to A21. After that, at the column below the last data insert this
formula in order to get the median ; =Median(A1:A20) and press enter.


CALCULATING
VARIANCE
The variance is a
measure of the variation of the sample data. The larger the variance, the more
random the answers appear. Most people find that standard deviation is a more
useful way of measuring variability.
The method for
calculating the variance is different depending on whether we are calculating
the variance of a population (everyone) or the variance of a sample. In order
to calculate the variance of a given sample data, one must follow the steps
provided below :
1.
Calculate
the mean of the sample data.
2.
Calculate
the difference between each value and mean. (Negative values might be obtained
and it is perfectly normal)
3.
Multiply
the answer in Step 2 to the power of 2 or in mathematical term “Square” it.
4.
Sum
up all the values calculated in step 3.
5.
For
the sample variance, we divide the sum in step 4 by the (sample size -1).
The formula for
the variance is :

X = respective sample value
= Sum of
X bar = Mean or average
N = Sample size
Similarly, Variance could be calculated in Microsoft Power
Point by inserting the appropriate formula. Firstly, the score is entered into the Microsoft Excel and
let’s use the tabulation above as example. As the result, the data entered
would range from row A2 to A21. After that, at the column below the last data
insert this formula in order to get the variance; =Var(A2:A21) and press enter.

CALCULATING THE STANDARD DEVIATION
The standard deviation, like variance, is a measure of the
variation of the sample data. The larger the standard deviation, the more
random the answers appear. Standard deviation is a more popular way of
measuring variation compared to the variance. The method of calculating
standard deviation is the same as the variance but with one extra step. The
steps of calculating standard deviation are :
1.
Calculate
the mean of the sample data.
2.
Calculate
the difference between each value and mean. (Negative values might be obtained
and it is perfectly normal)
3.
Multiply
the answer in Step 2 to the power of 2 or in mathematical term “Square” it.
4.
Sum
up all the values calculated in step 3.
5.
For
the sample variance, we divide the sum in step 4 by the (sample size -1).
6.
Lastly,
we take the square root of the value in step 5.
The formula for
calculating standard deviation is:
Again, similarly,standard deviation could be calculated in
Microsoft Power Point by inserting the appropriate formula. Firstly, the score is entered into the
Microsoft Excel and let’s use the tabulation above as example. As the result,
the data entered would range from row A2 to A21. After that, at the column
below the last data insert this formula in order to get the Standard Deviation;
=STDEV(A2:A21) and press enter.


2. THE PRETESTING PROCESS
The commissioning of exam questions must be carried out before they go live and tested on students. Once pre-editing and editing takes place, questions are placed into a "pretest bank". A pretest is a test paper that consist of a number of sections, similar to the real exam. Once the paper are distributed to the centres, administered, and returned back to the test constructors, the sample is marked, analysed and reviewed. The test constructors could therefore assesses the level of difficulty of the questions constructed in the test sample in relation to the accepted level for that particular exam. Apart from that, test constructors can also see how successfully each question discriminates between candidates whose overall performance varies.
Any editing done to the answer key, the multiple choice questions or the structure and content of the question may necessitate returning the question or section to another round of pretest to reevaluate and reviewed for its acceptance in the school and Examination Council standard and context.
WHAT IS INCLUDED IN A PRETEST
A complete set of pretesting sample should consists of following materials:
- Instructions to administrators
- A student register
- Well printed question papers
- The anchor test with Candidate Information Sheet
- Answering sheet, blank paper and any other relevant materials
- A feedback form for invigilators.
Pretest vary in length, but are designed to be administered within the teaching period. Each pretest usually consists of sections that are similar to the real examinations. Some pretests contain material intended for use in a revised exams and may contain question types that will not appear in a live examinations for a period of time. A revised examinations, however, is designed to test the same areas of language as the exam it replaces and indirectly provided students with the opportunity to try the new questions types.
Feedbacks From Invigilators
Feedbacks form about the pretests filled by the invigilators are extremely important as it provides a lot of information to the test constructors. This information and data are always analysed when considering whether or not the pretested materials is suitable for uses in a future live examinations.
The Anchor Test and Candidate Information Sheet
Live examinations are usually a combinations from a number of pretests obtained from the "live exam bank". It is therefore important for us to identify the difficulty of pretests and use some time to compare and contrast all the pretests we administer.
The Candidate Information Sheet, completed prior to the Anchor Test, allows us to compare the sample of candidates taking each pretest, as we need to ensure each pretest is administered to a range of candidates.
Answer Sheet
Most answer sheet for Multiple Choice Questions are scanned by the computers. Each answer sheet is personalised by the school examination board and it is important to ensure that the test takers or candidates maintain the same candidate number throughout all the pretest they participate in. The invigilator should also need to ensure that candidates must retain the same candidate number when they complete the student register.
How Should Pretest Be Administered
It is common that pretests may not always be administered in a live examinations hall, and are not invigilated by the officials of examination council. It is normally invigilated by the school teachers. In order to simulate the conditions of a real live examinations as well as to maintain the credibility of the data of the pretests, it is essential that every pretest should be administered in exactly the same way as live examinations with the same level of invigilation. For example, candidates are not allowed to talk during pretests and are not allowed to use any tools and materials that is considered as cheating in the process of answering the pretests. Pretest materials are intended to be used in the future live examinations and should therefore be treated as highly confidential. Photocopying or any other means of copying the pretests materials are strictly prohibited.
Subscribe to:
Comments (Atom)
